Sources

Where it all comes from

Every number, map and photograph here, and who made it. The words are written for this site. Where something is drawn by the computer rather than measured or photographed, it says so below. If you find a mistake, it is ours, not theirs.

Numbers

Sizes, masses, densities, gravity, temperatures, the length of each day and year, and the moon counts come from the NASA Space Science Data Coordinated Archive fact sheets, one for each body.

Moon counts change as new moons are confirmed, so they are only as current as NASA’s sheet.
Where the planets are

The model on the front page places each planet from the mean orbital elements in Keplerian Elements for Approximate Positions of the Major Planets (NASA/JPL Solar System Dynamics, Table 1, good from 1800 to 2050). That puts each planet within a fraction of a degree of where it really is, plenty for a picture, though it is not a full ephemeris.

Where a page says where the Sun stands in another world’s sky, the angle comes from JPL Horizons: the sub-solar latitude on 9 November 2026 was 74.3° north on Uranus and 19.5° south on Neptune.

Maps of the surfaces

The global colour maps wrapped round each world are from Solar System Scope, under a Creative Commons Attribution 4.0 licence. They are built from NASA mission imagery: MESSENGER for Mercury, Viking and later orbiters for Mars, Cassini for Jupiter and Saturn, and NASA’s Blue Marble and Black Marble for the Earth by day and night. Heliocodex only resizes them to 4k and 8k and saves them smaller, with Mercury and the Earth’s clouds in greyscale.

The stars

The 9,000 or so stars behind every scene are the Yale Bright Star Catalogue (5th revised edition, Hoffleit and Warren, via NASA HEASARC): every star you could see from a dark site on Earth, placed where it really is, sized by brightness and coloured by its measured colour index.

Saturn’s rings

The rings are drawn from the measured edges of each ring and gap in the NASA Saturnian Rings Fact Sheet, from the faint D ring to the F ring, with each ring as see-through as it really is. The fine ringlets inside them are added by hand.

What is drawn, not photographed

No spacecraft has stood where most of these pages take you, so the close-up scenes are generated as you watch. They follow what the missions saw and measured, but they are not photographs:

  • The Sun granules at their real size of about 1,500 km, the supergranule network, a sunspot with its umbra, penumbra and the dip in the middle, and the darkening towards the edge of the disc.
  • Mercury and Mars the ground, rocks and small craters below the resolution of the maps.
  • Venus the surface under the cloud, modelled on the photographs the Venera landers sent back.
  • Earth the sea and clouds close up.
  • Jupiter, Saturn, Uranus and Neptune the cloud decks and hazes, and where they sit relative to the Sun and moons.

Every photograph

15 pictures, all from NASA missions and photographers. NASA material is free to use for this kind of purpose, but NASA does not endorse this site.

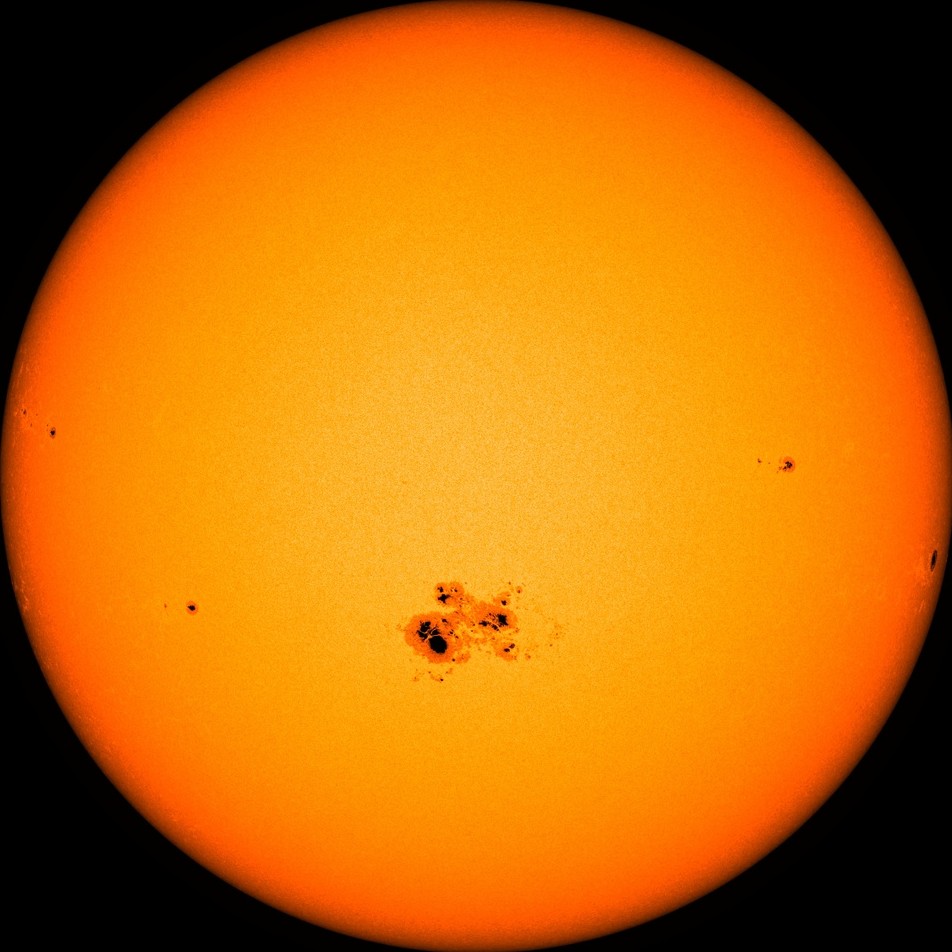
  1. The Sun as an orange disc, darker towards the edge, with a large cluster of dark sunspots below the middle and a few small spots elsewhere.

    The Sun

    Active region 2192, the largest sunspot group since 1990, on 23 October 2014. Solar Dynamics Observatory, visible light. Image: NASA/SDO/HMI.

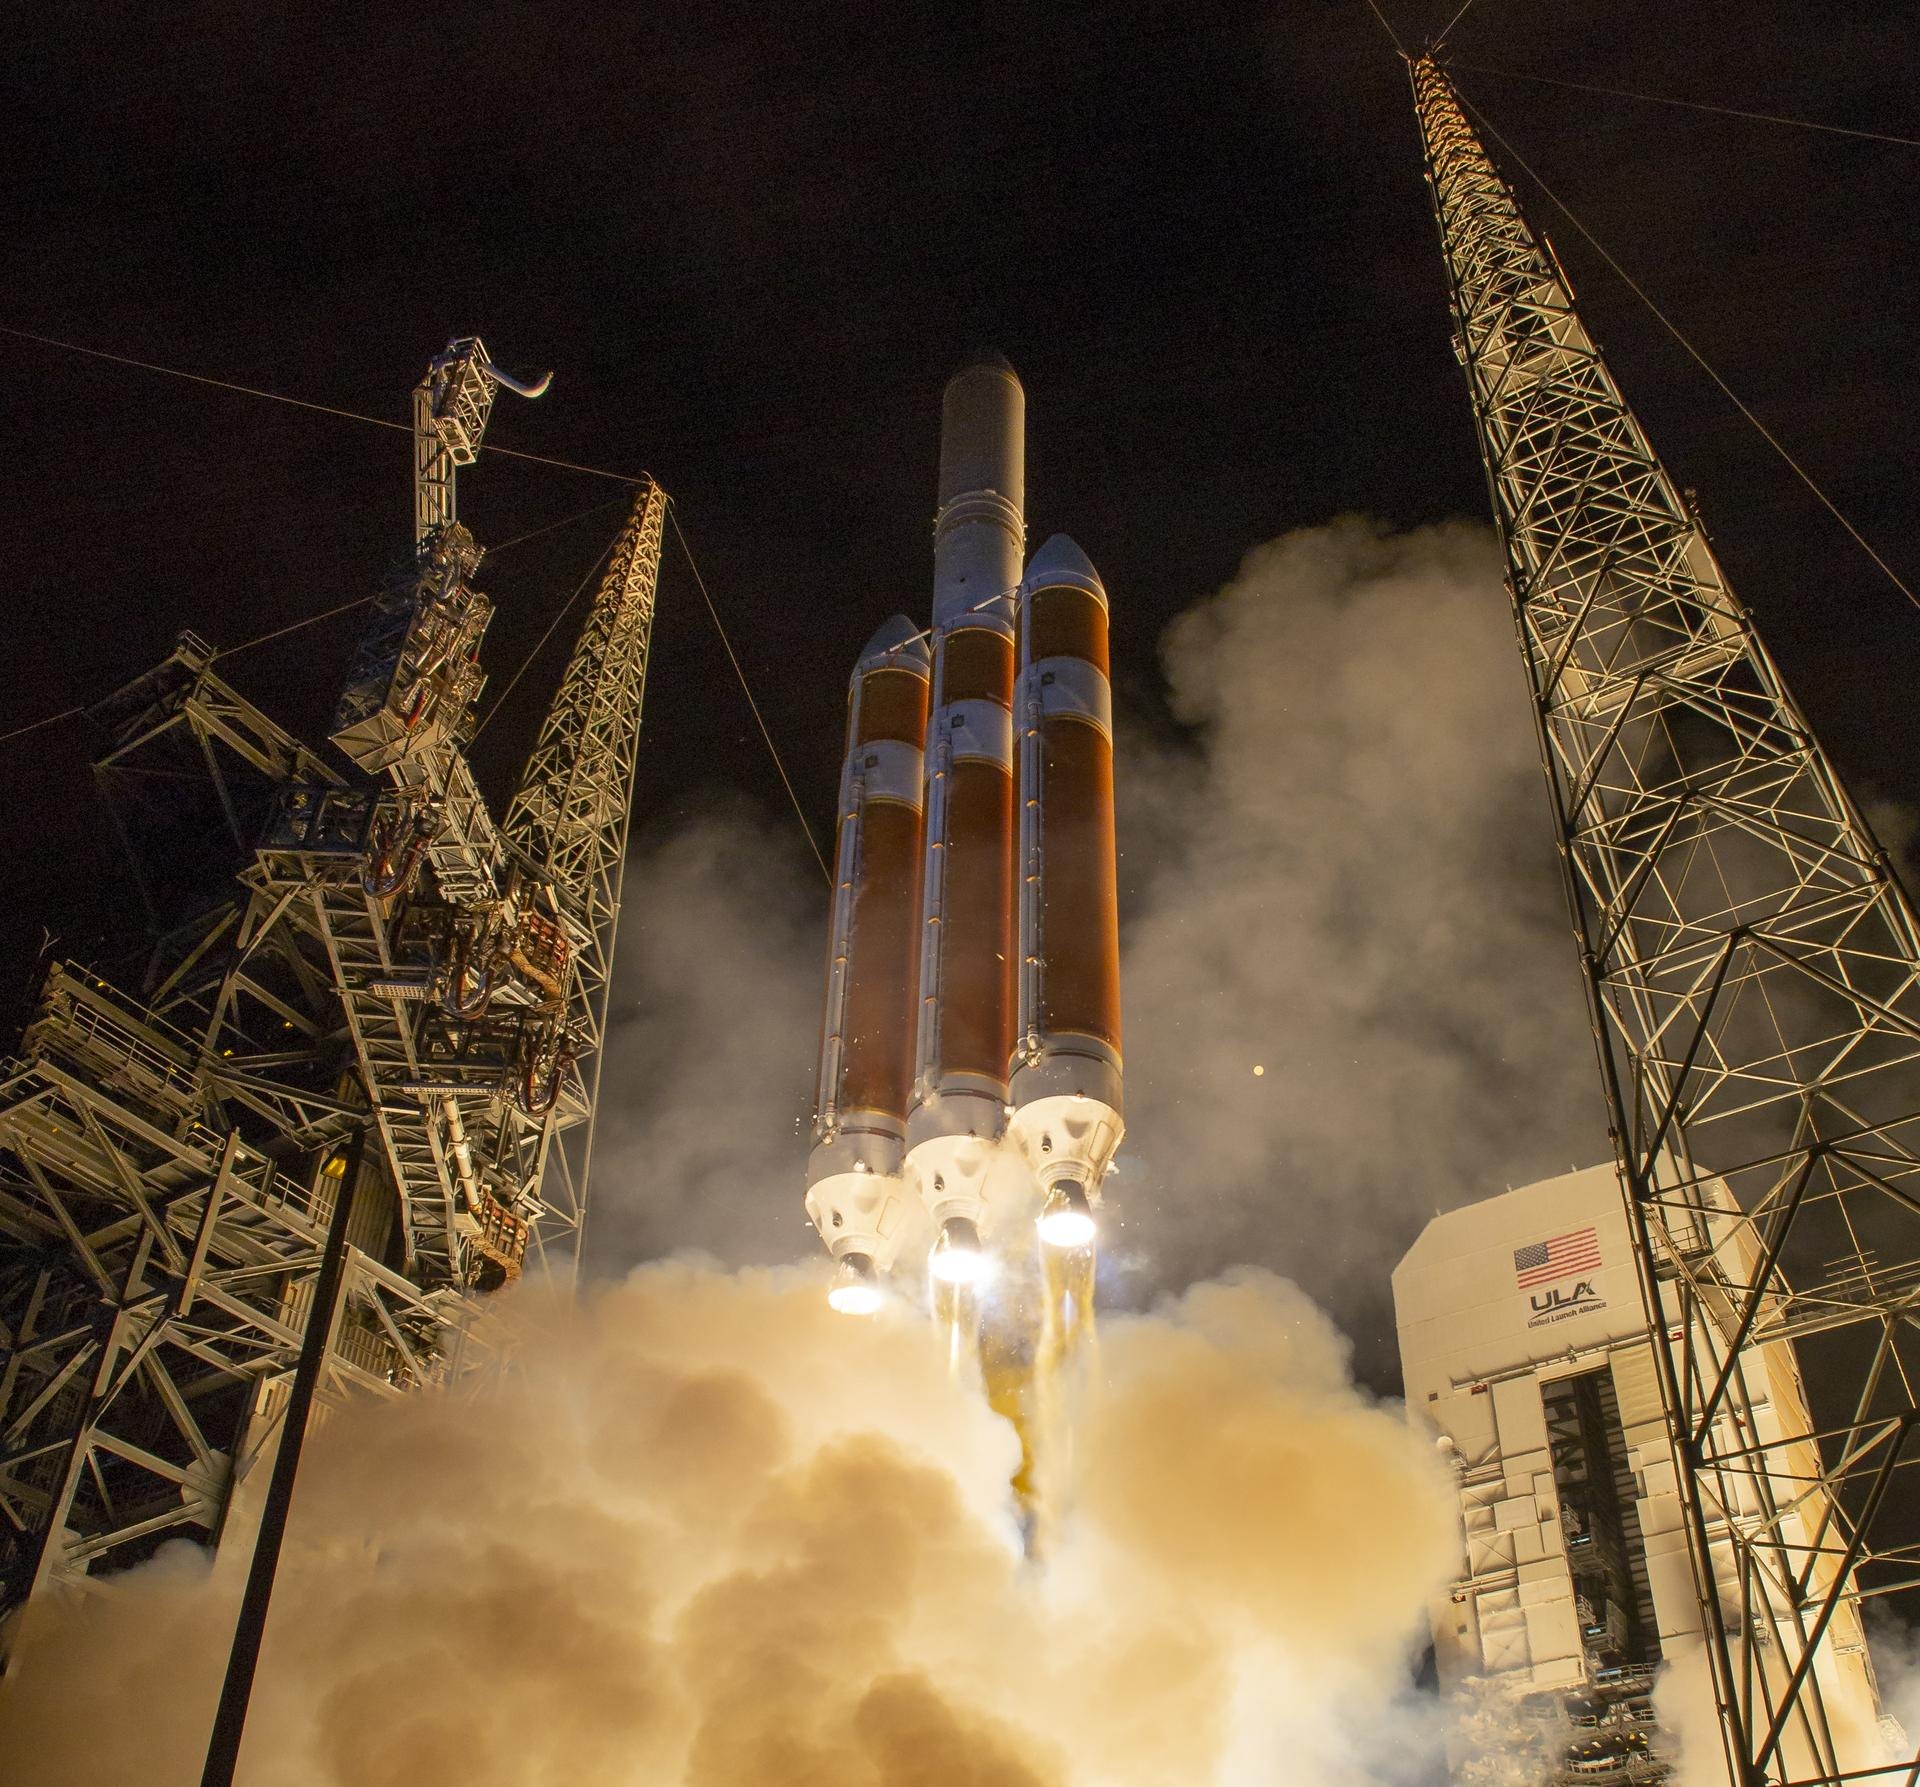
  2. A tall orange rocket with three cores lifting off at night between two launch towers, lit from below by its engines in a cloud of smoke.

    The Sun

    A Delta IV Heavy carrying Parker Solar Probe lifts off from Cape Canaveral, 12 August 2018. Image: NASA/Bill Ingalls.

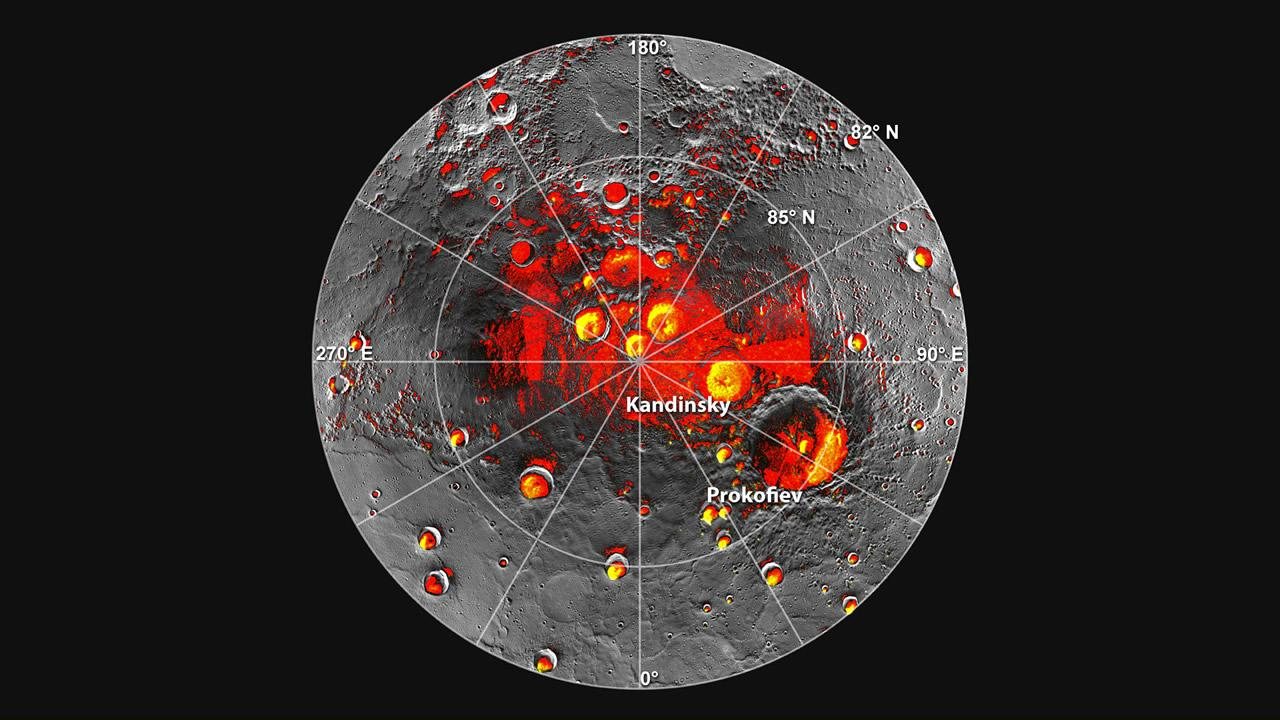
  3. Mercury's north polar region seen from above, grey and cratered. Crater floors shaded red are always in shadow, and yellow patches inside many of them show where radar found ice.

    Mercury

    Mercury’s north pole. Red: ground in shadow in every MESSENGER image. Yellow: radar-bright deposits seen from Earth. Image: NASA/JHU APL/Carnegie Institution of Washington.

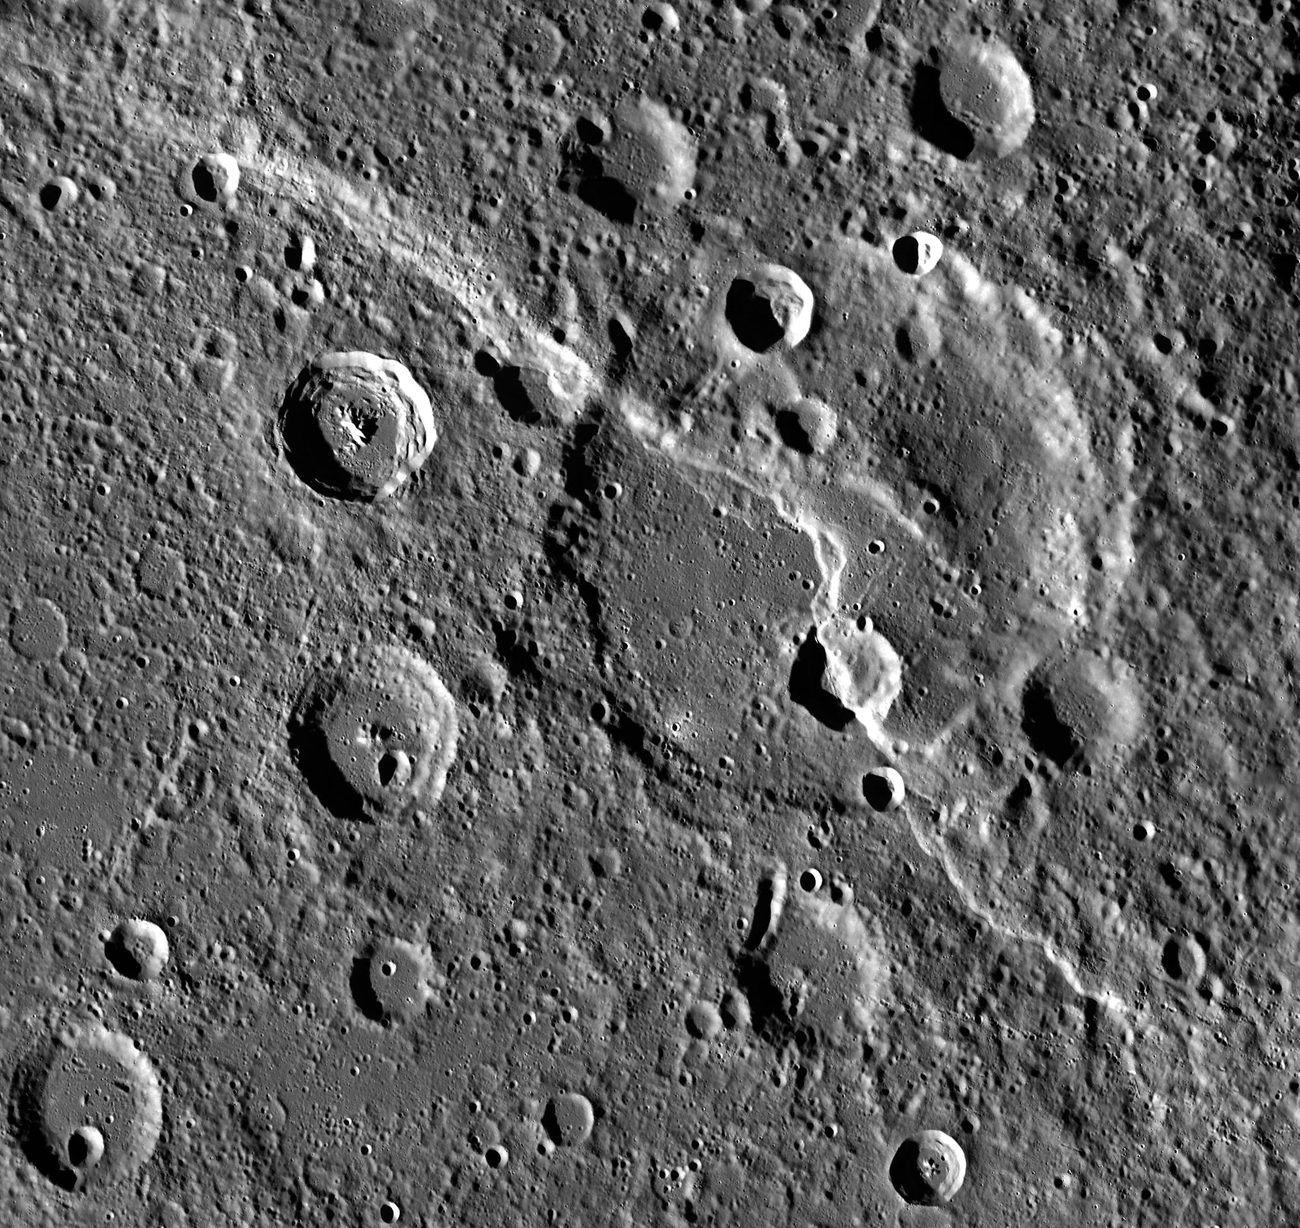
  4. Black and white view from above of heavily cratered ground, with a winding cliff running through the middle and cutting across an older crater.

    Mercury

    Carnegie Rupes, a cliff nearly 2 km high, cutting through Duccio crater. MESSENGER. Image: NASA/JHU APL/Carnegie Institution of Washington.

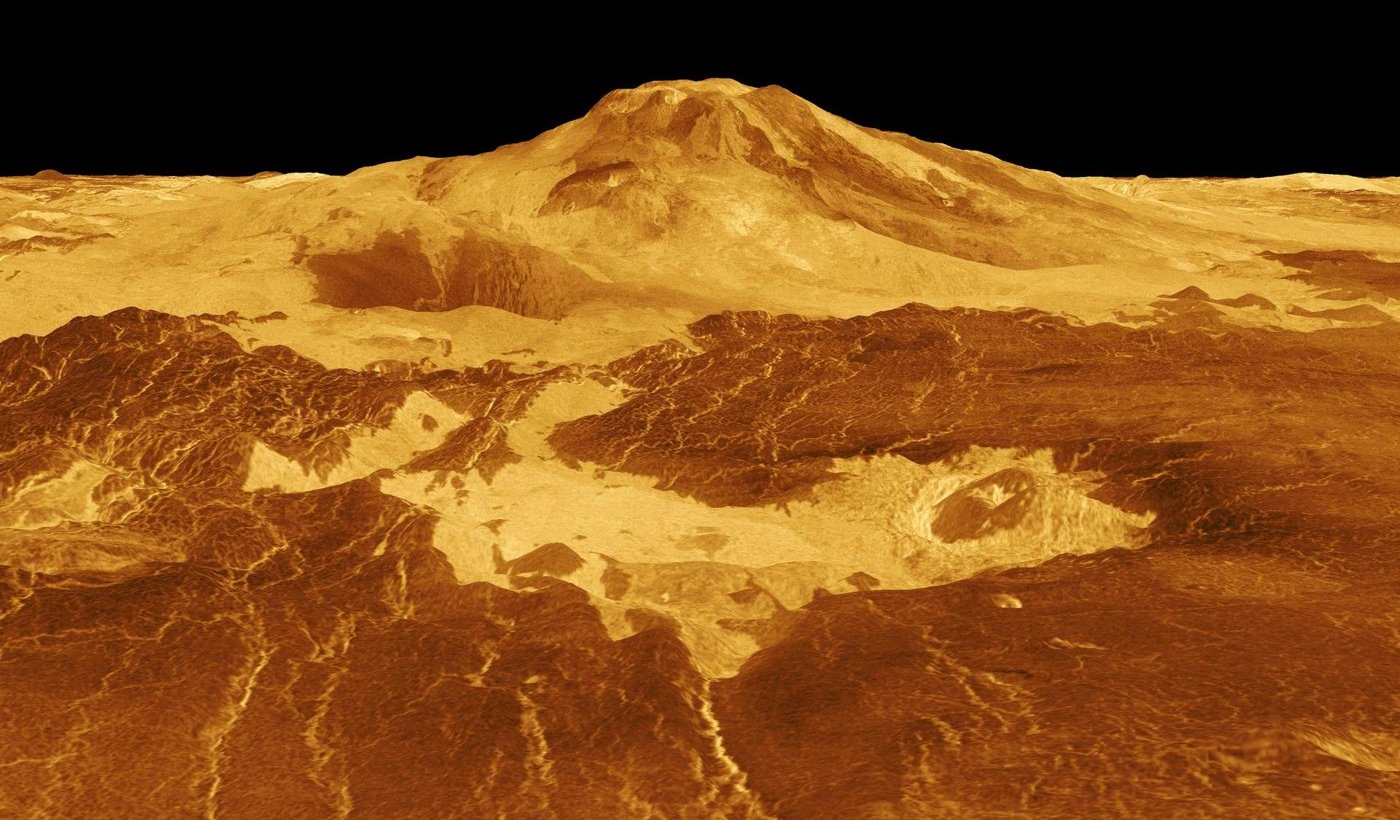
  5. A computer-generated view across orange lava plains toward the broad dome of the volcano Maat Mons under a black sky.

    Venus

    Maat Mons, one of the largest volcanoes on Venus. Computer-generated from Magellan radar data, with the height exaggerated and colour added. Image: NASA/JPL.

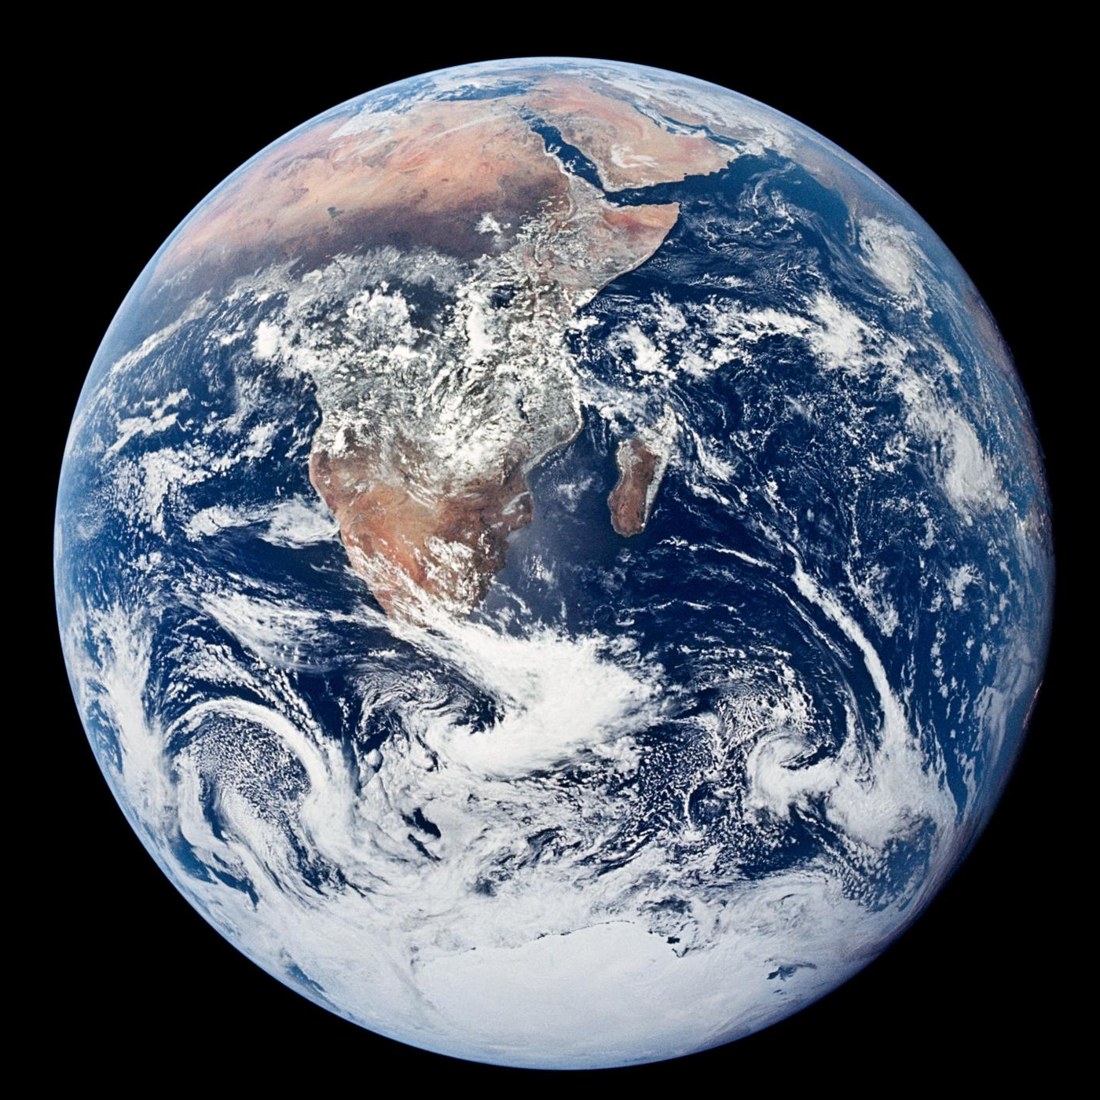
  6. The whole Earth against black space, with Africa and white Antarctic ice and swirls of cloud.

    Earth

    The whole Earth, photographed by the crew of Apollo 17, December 1972. Image: NASA.

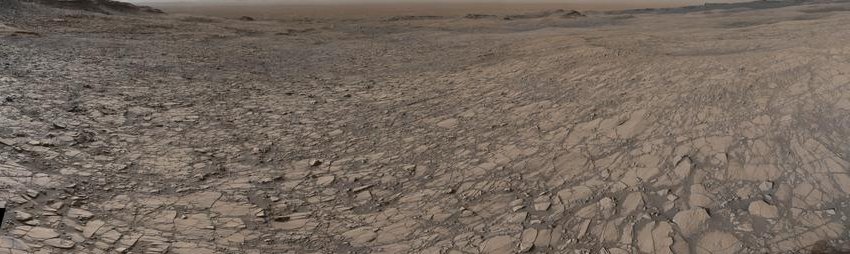
  7. A wide stretch of fractured, pale-brown bedrock under a hazy sky.

    Mars

    Fractured bedrock near the Murray Buttes, Gale Crater. Curiosity’s Mastcam, 5 August 2016. Image: NASA/JPL-Caltech/MSSS.

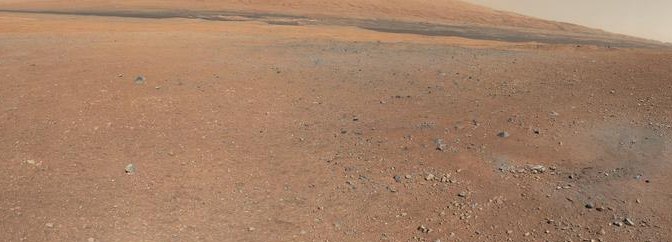
  8. A smooth rust-coloured slope, Mount Sharp, rising over a flat plain of dark gravel.

    Mars

    Mount Sharp, 5 km high, rising from the crater floor. Curiosity, 2012. Image: NASA/JPL-Caltech/MSSS.

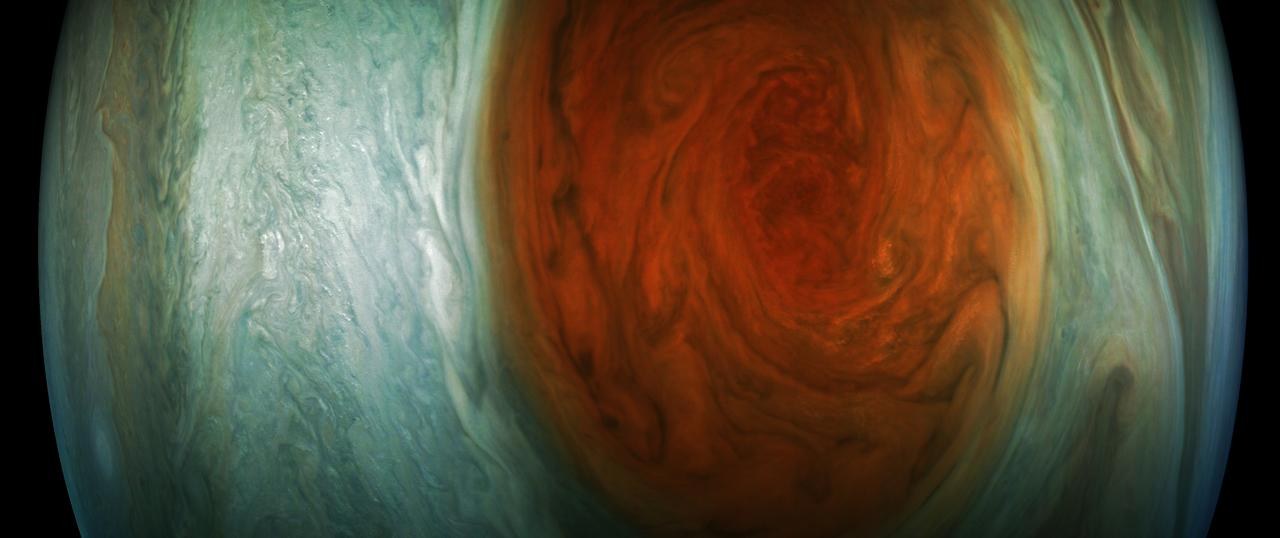
  9. A close view of the swirling rust-red Great Red Spot, surrounded by pale blue-green cloud bands.

    Jupiter

    The Great Red Spot, 10 July 2017. Enhanced colour image by Gerald Eichstädt from JunoCam data. Image: NASA/JPL-Caltech/SwRI/MSSS.

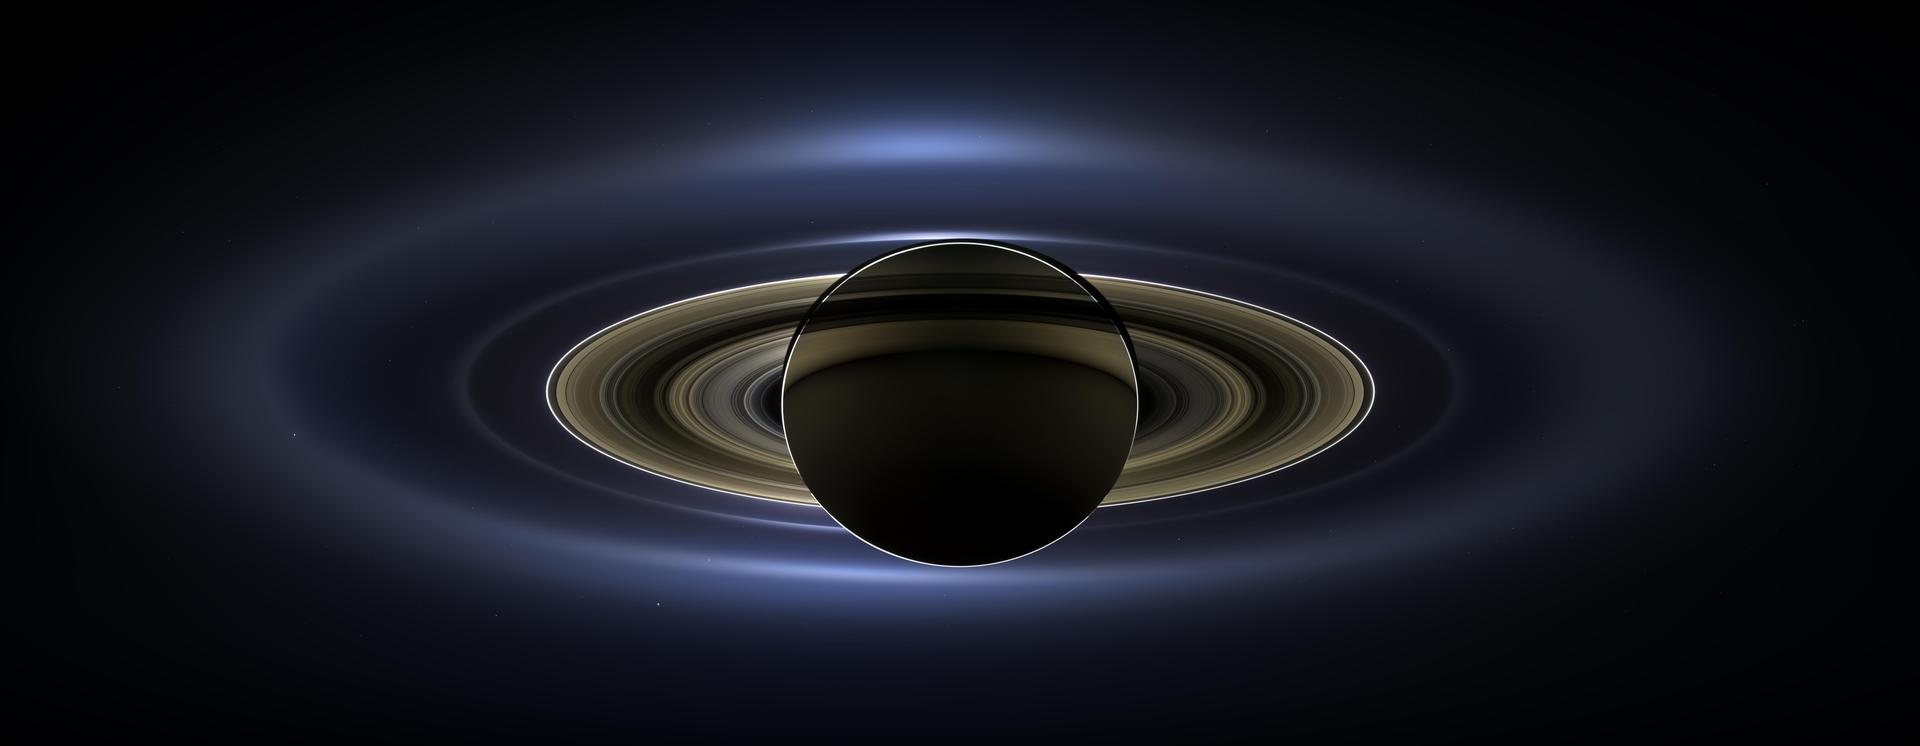
  10. Saturn seen from its night side as a dark disc, ringed by glowing bands of the rings and fainter haze rings around them.

    Saturn

    Saturn backlit by the Sun, 19 July 2013. Earth is the faint dot below the rings at lower right. Cassini. Image: NASA/JPL-Caltech/Space Science Institute.

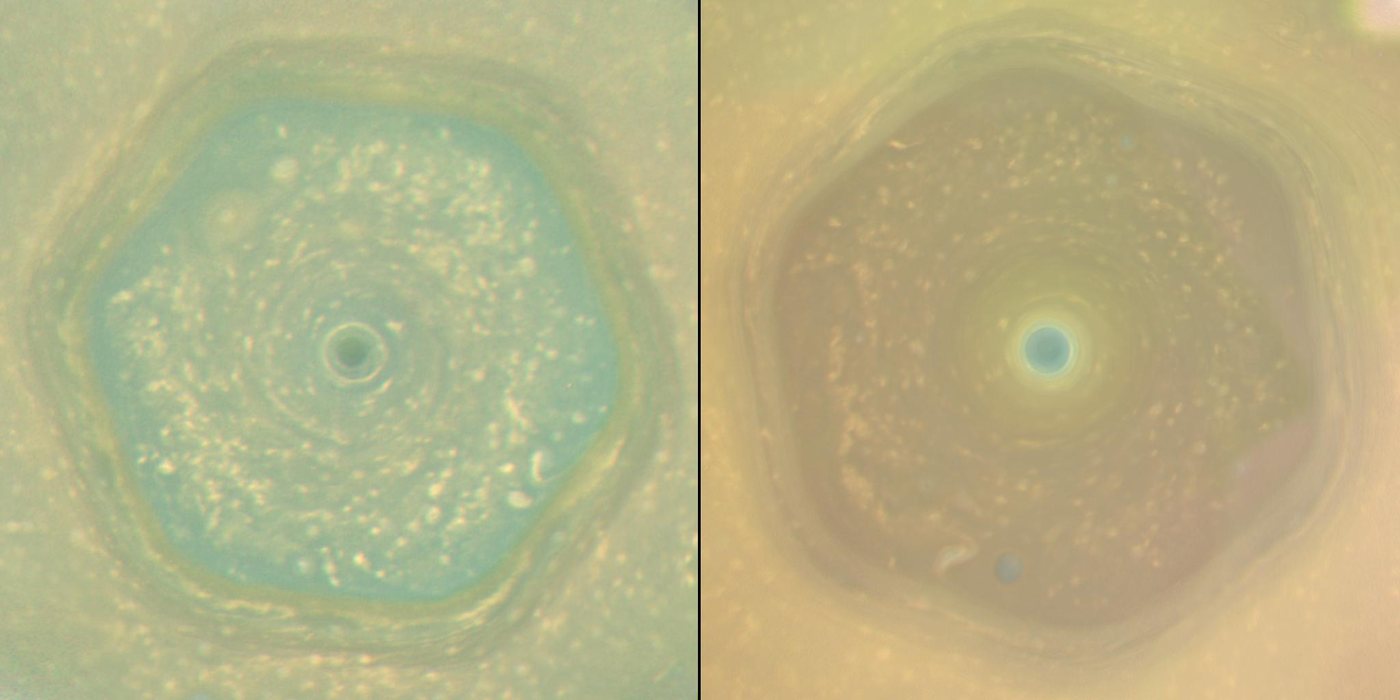
  11. Two views of Saturn's north pole side by side, each showing a six-sided band of cloud around a small central vortex. The left one is blue-green, the right one golden.

    Saturn

    The north polar hexagon in June 2013 and April 2017. Cassini. Image: NASA/JPL-Caltech/Space Science Institute/Hampton University.

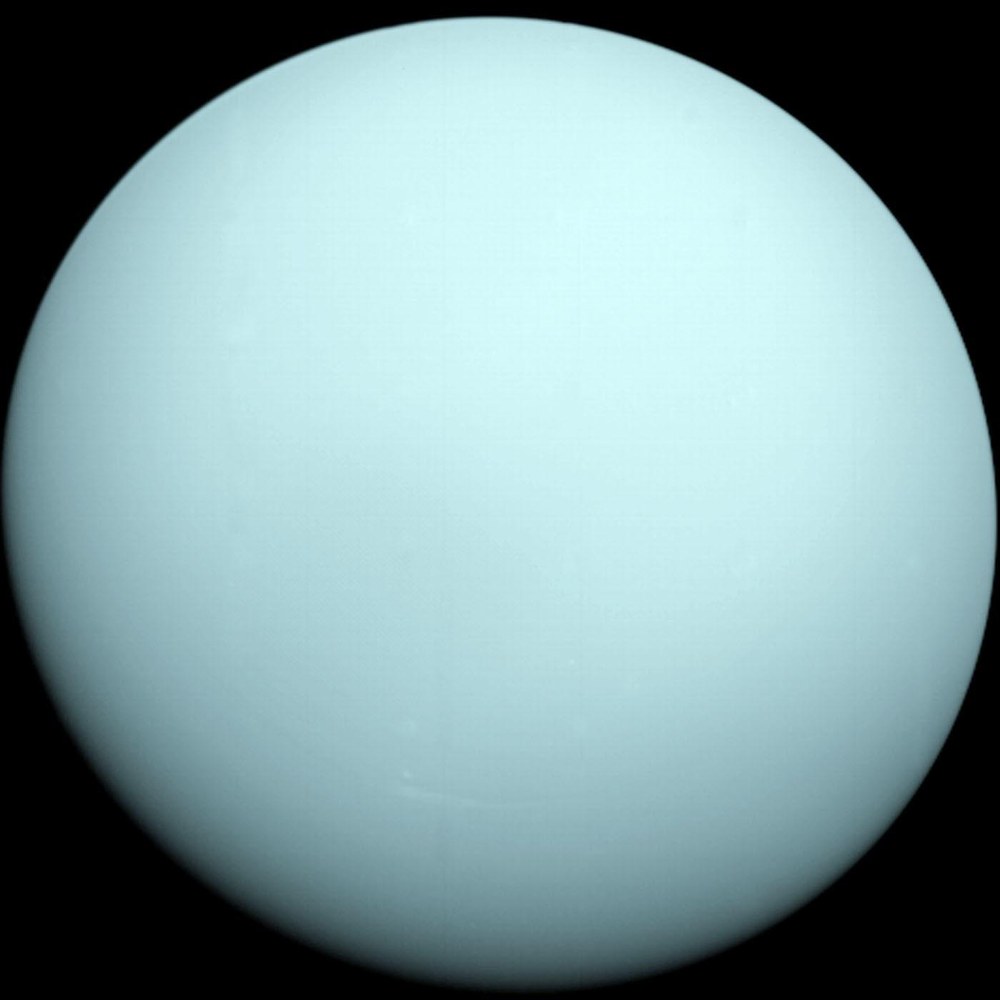
  12. Uranus as a plain, pale blue-green sphere against black space, with almost no visible markings.

    Uranus

    Uranus in roughly true colour, as Voyager 2 saw it in January 1986. Image: NASA/JPL-Caltech.

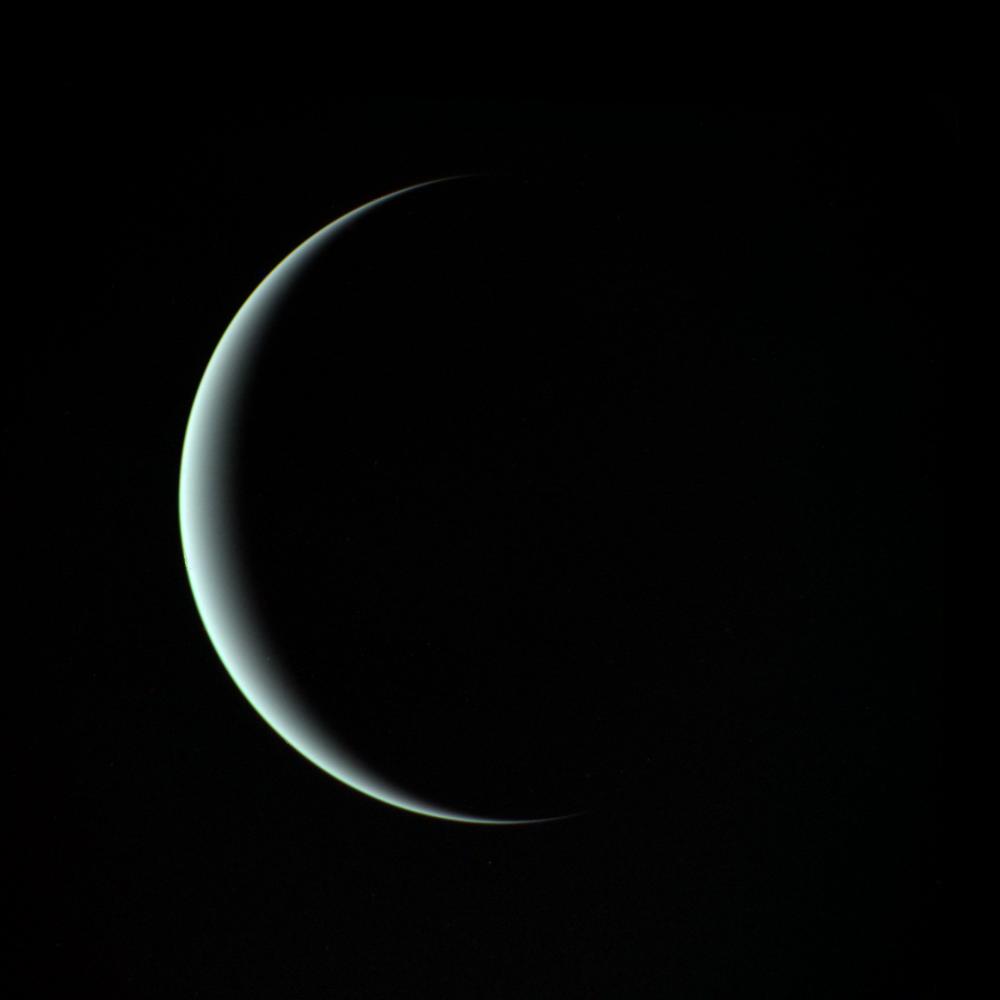
  13. A thin blue-white crescent of Uranus against black space, the rest of the planet in darkness.

    Uranus

    A crescent Uranus, seen by Voyager 2 as it left. Image: NASA/JPL.

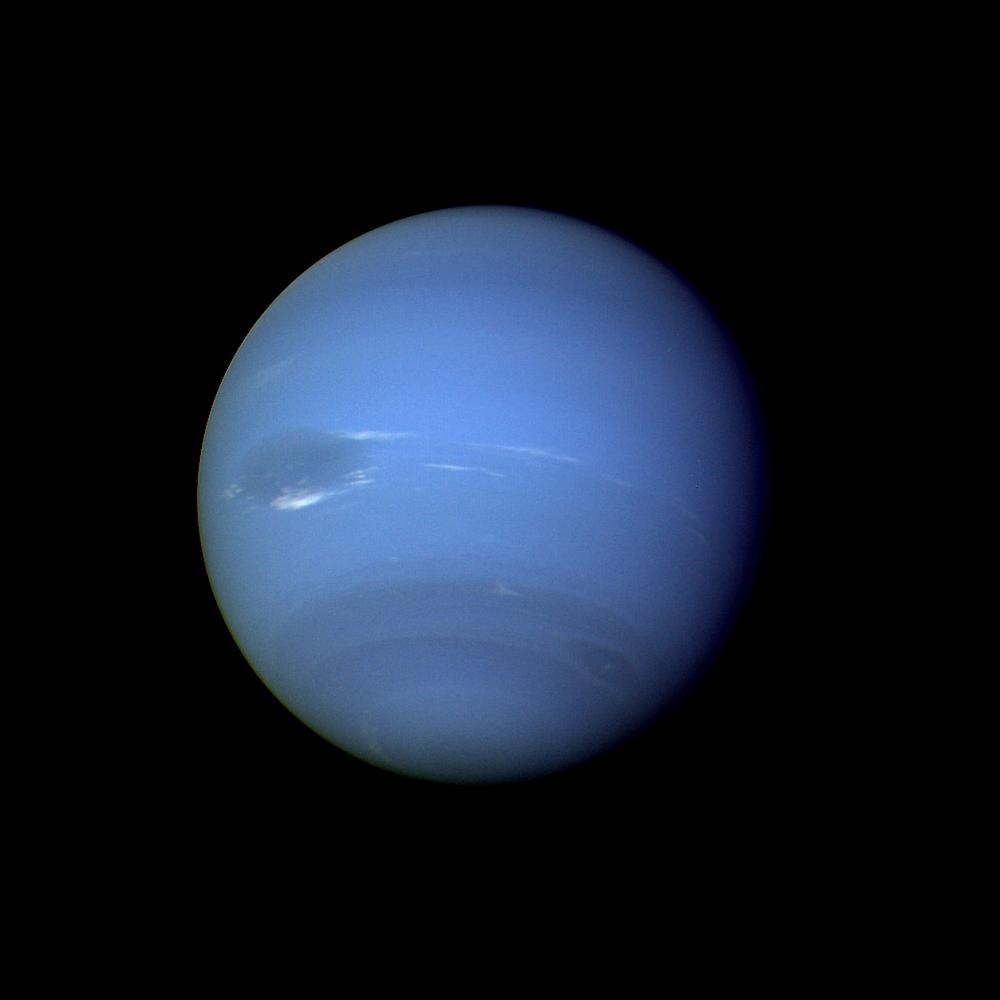
  14. Neptune as a deep blue globe with a large dark oval storm left of centre, bright white clouds beside it, and fainter bands and a smaller dark spot further south.

    Neptune

    Neptune with the Great Dark Spot, left of centre. Voyager 2, August 1989. Image: NASA/JPL.

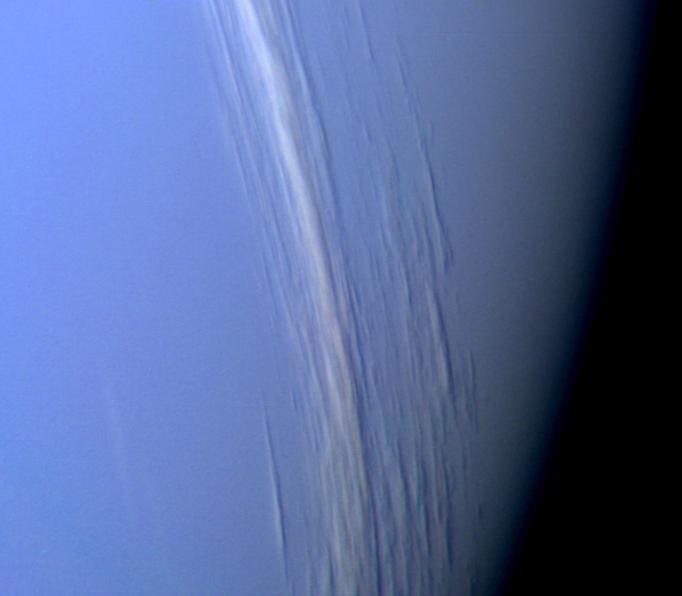
  15. Close view of Neptune's limb: a blue cloud deck with long white streaks of cloud, each with a dark shadow line beside it.

    Neptune

    Streaks of high cloud at 29° north, each with its shadow on the deck below. The Sun is to the lower left. Voyager 2, 25 August 1989. Image: NASA/JPL.

Type and code

Each page has its own typeface, all free under the SIL Open Font Licence and served from this site through Fontsource: Spectral, IBM Plex, Fraunces, Archivo, Bodoni Moda, Source Serif, Libre Caslon, Newsreader, Young Serif, Literata, Bevan, Libre Franklin, Italiana, EB Garamond, Instrument Serif and Big Shoulders. The site is built with Astro and draws in 3D with three.js, both under the MIT licence.

Heliocodex is an independent project. It is not connected to NASA, JPL, Solar System Scope or any of the missions named here.